Note
Click here to download the full example code
Combining AIA and STEREO maps
Import required functions
from datetime import datetime, timedelta

import astropy.units as u
import matplotlib.colors as mcolor
import matplotlib.pyplot as plt
import numpy as np
import sunpy.map

from solarsynoptic.combine import coadd, weights_longitude
from solarsynoptic.data import aia_start_of_day_map, stereo_start_of_day_map
from solarsynoptic.reprojection import reproject_carrington
Define the output of the shape map. This is number of pixels in latitude and longitude.
shape_out = [720, 1440]
Download STEREO maps
maps_in_stereo = []
for i in range(2):
    d = datetime.now() - timedelta(days=i) - timedelta(days=1)
    smap = stereo_start_of_day_map(d)
    # Normalise to AIA
    data = (smap.data - 720.0) * 110 / 170
    data[data < 0] = np.nan
    smap = sunpy.map.Map((data, smap.meta))
    maps_in_stereo.append(smap)
Files Downloaded:   0%|          | 0/1 [00:00<?, ?file/s]

20230131_174545_n7euA.fts:   0%|          | 0.00/547k [00:00<?, ?B/s]

20230131_174545_n7euA.fts:   0%|          | 100/547k [00:00<11:07, 820B/s]


Files Downloaded: 100%|##########| 1/1 [00:00<00:00,  2.92file/s]
Files Downloaded: 100%|##########| 1/1 [00:00<00:00,  2.92file/s]

Files Downloaded:   0%|          | 0/1 [00:00<?, ?file/s]

20230131_175500_n7euA.fts:   0%|          | 0.00/547k [00:00<?, ?B/s]

20230131_175500_n7euA.fts:   0%|          | 100/547k [00:00<11:01, 827B/s]

20230131_175500_n7euA.fts:  98%|#########7| 534k/547k [00:00<00:00, 2.82MB/s]


Files Downloaded: 100%|##########| 1/1 [00:00<00:00,  2.70file/s]
Files Downloaded: 100%|##########| 1/1 [00:00<00:00,  2.69file/s]

Files Downloaded:   0%|          | 0/1 [00:00<?, ?file/s]

20230130_174545_n7euA.fts:   0%|          | 0.00/547k [00:00<?, ?B/s]

20230130_174545_n7euA.fts:   0%|          | 100/547k [00:00<11:03, 825B/s]

20230130_174545_n7euA.fts:  81%|########1 | 446k/547k [00:00<00:00, 2.36MB/s]


Files Downloaded: 100%|##########| 1/1 [00:00<00:00,  1.28file/s]
Files Downloaded: 100%|##########| 1/1 [00:00<00:00,  1.28file/s]

Files Downloaded:   0%|          | 0/1 [00:00<?, ?file/s]

20230130_175500_n7euA.fts:   0%|          | 0.00/547k [00:00<?, ?B/s]

20230130_175500_n7euA.fts:   0%|          | 100/547k [00:00<11:06, 821B/s]

20230130_175500_n7euA.fts:  87%|########7 | 478k/547k [00:00<00:00, 2.31MB/s]


Files Downloaded: 100%|##########| 1/1 [00:00<00:00,  2.50file/s]
Files Downloaded: 100%|##########| 1/1 [00:00<00:00,  2.50file/s]
Download AIA maps
maps_in_aia = []
for i in range(2):
    d = datetime.now() - timedelta(days=i) - timedelta(days=1)
    maps_in_aia.append(aia_start_of_day_map(d, 193 * u.Angstrom))

norm = maps_in_aia[0].plot_settings['norm']
norm.vmin = 40
norm.vmax = 5000
INFO: Downloading AIA 193 near real time map to /home/docs/sunpy/data/aia_193_20230131_nrt.fits [solarsynoptic.data.aia]

Files Downloaded:   0%|          | 0/1 [00:00<?, ?file/s]

aia_193_20230131_nrt.fits:   0%|          | 0.00/1.25M [00:00<?, ?B/s]

aia_193_20230131_nrt.fits:   0%|          | 100/1.25M [00:00<24:48, 838B/s]

aia_193_20230131_nrt.fits:   5%|4         | 57.8k/1.25M [00:00<00:04, 290kB/s]

aia_193_20230131_nrt.fits:  17%|#6        | 207k/1.25M [00:00<00:01, 743kB/s]

aia_193_20230131_nrt.fits:  41%|####1     | 513k/1.25M [00:00<00:00, 1.49MB/s]

aia_193_20230131_nrt.fits:  84%|########3 | 1.04M/1.25M [00:00<00:00, 2.60MB/s]


Files Downloaded: 100%|##########| 1/1 [00:00<00:00,  1.35file/s]
Files Downloaded: 100%|##########| 1/1 [00:00<00:00,  1.35file/s]
INFO: Downloading AIA 193 near real time map to /home/docs/sunpy/data/aia_193_20230130_nrt.fits [solarsynoptic.data.aia]

Files Downloaded:   0%|          | 0/1 [00:00<?, ?file/s]

aia_193_20230130_nrt.fits:   0%|          | 0.00/1.25M [00:00<?, ?B/s]

aia_193_20230130_nrt.fits:   0%|          | 100/1.25M [00:00<24:48, 838B/s]

aia_193_20230130_nrt.fits:   5%|4         | 60.7k/1.25M [00:00<00:03, 305kB/s]

aia_193_20230130_nrt.fits:  17%|#6        | 211k/1.25M [00:00<00:01, 756kB/s]

aia_193_20230130_nrt.fits:  42%|####2     | 527k/1.25M [00:00<00:00, 1.53MB/s]

aia_193_20230130_nrt.fits:  94%|#########4| 1.18M/1.25M [00:00<00:00, 2.83MB/s]


Files Downloaded: 100%|##########| 1/1 [00:00<00:00,  1.36file/s]
Files Downloaded: 100%|##########| 1/1 [00:00<00:00,  1.36file/s]
Reproject the maps into a Carrington frame of reference
maps_in_stereo = [reproject_carrington(map_in, shape_out) for map_in in maps_in_stereo]
maps_in_aia = [reproject_carrington(map_in, shape_out) for map_in in maps_in_aia]


def weight_function(smap):
    weights = weights_longitude(30 * u.deg)(smap)
    factor = (datetime.now() - smap.date.to_datetime()) / timedelta(days=1)
    return weights / factor
INFO: Setting rsun_ref in metadata [solarsynoptic.reprojection.reprojection]
INFO: Reprojecting EUVI-A 195.0 Angstrom 2023-01-31 17:55:00 [solarsynoptic.reprojection.reprojection]
INFO: Setting rsun_ref in metadata [solarsynoptic.reprojection.reprojection]
INFO: Reprojecting EUVI-A 195.0 Angstrom 2023-01-30 17:55:00 [solarsynoptic.reprojection.reprojection]
INFO: Overwriting rsun_ref with standard photospheric radius [solarsynoptic.reprojection.reprojection]
INFO: Reprojecting AIA 193.0 Angstrom 2023-01-31 00:00:04 [solarsynoptic.reprojection.reprojection]
INFO: Overwriting rsun_ref with standard photospheric radius [solarsynoptic.reprojection.reprojection]
INFO: Reprojecting AIA 193.0 Angstrom 2023-01-30 00:00:04 [solarsynoptic.reprojection.reprojection]
Add the maps together
dtime = datetime.now().strftime('%Y-%m-%d')
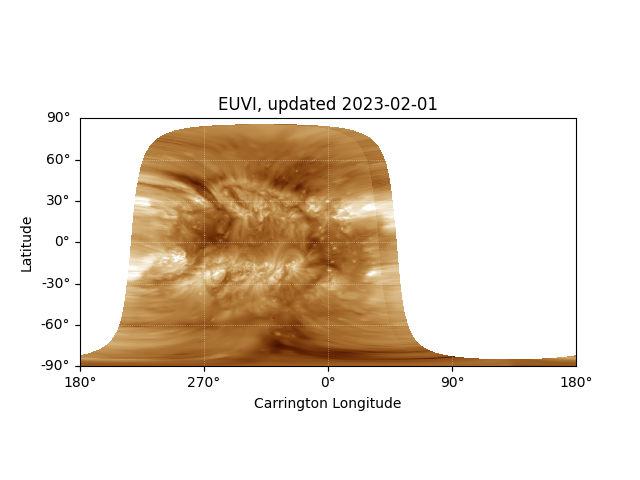
# Just the STEREO maps
map_out = coadd(maps_in_stereo, weight_function=weight_function)
fig = plt.figure()
map_out.plot(cmap='sdoaia193', norm=norm)
map_out.save(f'stereo_synoptic_{dtime}.fits')
plt.gca().set_title(f'EUVI, updated {dtime}')
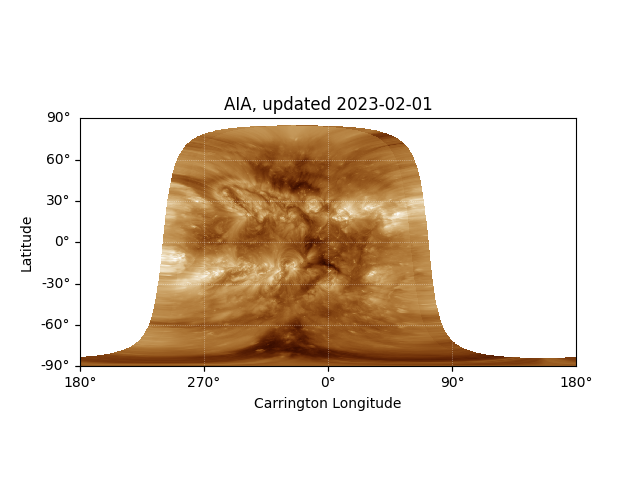
# Just tthe AIA maps
map_out = coadd(maps_in_aia, weight_function=weight_function)
fig = plt.figure()
map_out.plot(cmap='sdoaia193', norm=norm)
map_out.save(f'aia_synoptic_{dtime}.fits')
plt.gca().set_title(f'AIA, updated {dtime}')
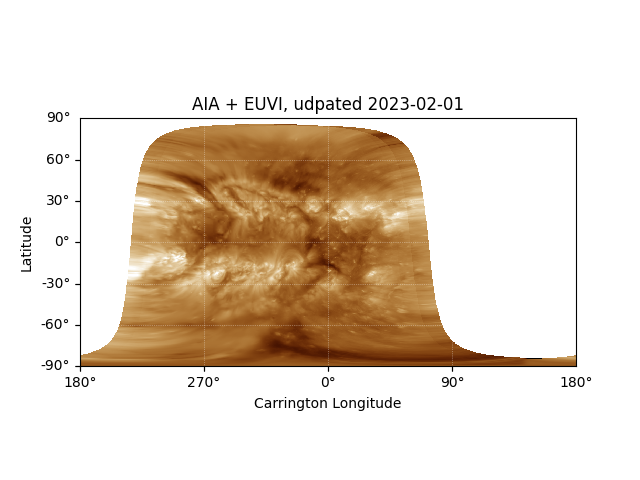
# STEREO and AIA maps
map_out = coadd(maps_in_aia + maps_in_stereo, weight_function=weight_function)
map_out.save(f'aia_euvi_synoptic_{dtime}.fits', overwrite=True)
fig = plt.figure()
map_out = sunpy.map.Map((norm(map_out.data), map_out.meta))
map_out.plot(cmap='sdoaia193', norm=mcolor.Normalize(vmin=0, vmax=1))
plt.gca().set_title(f'AIA + EUVI, udpated {dtime}')
plt.show()
Total running time of the script: ( 0 minutes 17.400 seconds)